


Influence of cell charge-discharge rate on volume expansion in shelving stage
Author:INITIAL ENERGY SCIENCE&TECHNOLOGY Co.,Ltd(IEST)
Click:
Time:2022-02-15 12:00:00
Lithium-ion batteries are accompanied by volume expansion, including structural expansion and gas production expansion, during the process of formation, cycling, storage, and overcharging. The charge-discharge rate determines the rate of the lithium-deintercalation reaction of the battery cell, and it is also accompanied by different degrees of heat generation or lithium evolution. When researchers study the electrical properties of the battery cell, they usually add a certain amount of time at the end of charging or discharging. The shelving stabilizes the cell state and eliminates thermal effects or polarization. How does the volume of the cell change during the shelving stage? In this paper, the in-situ monitoring of the volume expansion of the pouch cells of the LCO/Graphite system after different magnifications was carried out to explore the effect of magnification on the expansion.

Figure 1. Various factors affecting fast charging of lithium-ion batteries[1]
1. Experimental test information
1. Test equipment: In-situ gas production volume monitor, model GVM2200 (IEST Yuanneng Technology), the temperature can be adjusted from 20°C to 80°C, as shown in Figure 2.
Figure 2. In-situ Gas Production Volume Monitor
2. Test parameters: cell information is shown in Table 1.
| Cell information | |
|---|---|
| system | LCO/Graphite |
| capacity | 2000mAh |
| Voltage | 2.8-4.35V |
| model | Soft Case-345877 |
Table 1. Cell Information
3. Experimental parameters: Set up four experimental groups according to the parameters in Table 2 below. After each charge and discharge, leave the battery for 1 hour, then place the battery in the in-situ gas production volume monitor, and adjust the oil bath temperature to 25 °C. And real-time monitoring of cell volume changes.
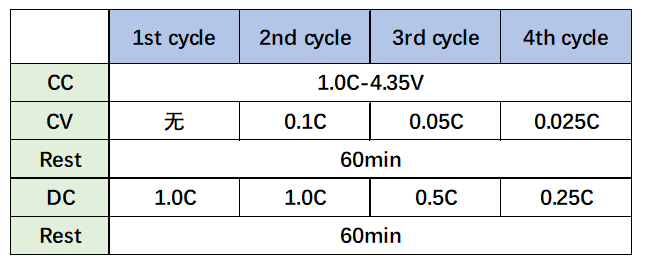
Table 2. Charge and discharge parameters
2. Analysis of experimental results
1. In-situ monitoring of the volume expansion curve of the whole process cell
The charge-discharge curves and volume change curves of the four cycles are shown in Fig. 3. Constant current charging stage: As the SOC continues to increase, the volume continues to expand, which is mainly related to the structural expansion caused by the continuous insertion of lithium ions into the graphite. After entering the constant voltage and shelving stage, the volume of the cell begins to shrink and gradually stabilizes. In the constant current discharge stage: as the DOD gradually increases, the volume of the cell shrinks continuously. When the discharge rate gradually becomes smaller, the abnormal volume expansion of the cell at the initial stage of discharge also gradually decreases. In the shelving stage after discharge, the volume of the cell continues to decrease and tends to be stable over time. Next, we perform a detailed analysis of the shelving phases A and B after charging and discharging.

Figure 3. Different charging and discharging current and volume change curves of cells
2. Volume expansion analysis during charging and resting stage
Select the resting part A after charging for each circle in Figure 3 for analysis, as shown in Figure 4. Since the cut-off current of each lap of charging gradually decreases, from the volume curve of shelving, when there is no CV in the first lap, the cut-off current of charging is 1C. At this time, the volume gradually decreases with the shelving time, and remains unchanged after about 1500s. Change. The constant voltage stage is added in the last three laps. When the charge cut-off current is less than 0.1C, the volume shrinkage appears at the position where the constant voltage starts. When the battery is put on hold after charging, the volume basically does not change. This shows that the volume shrinkage is related to the current reduction. When there is a constant voltage, the current reduction will be accompanied by volume shrinkage. This is likely to be due to the reduction of the internal polarization of the battery during the constant voltage stage, and the reduction of the lithium concentration difference in the electrode thickness direction. Reduction of stress and strain caused by concentration difference If there is no constant voltage stage, at the end of charging, the internal polarization of the battery is very large, and the difference in lithium concentration is also large. When the stress and strain are released, it will take at least half an hour to reach a stable state.

Figure 4. Effect of charge cut-off current on shelving volume
In order to further explain the lithium ion transport process and the evolution process of the state of charge in the battery during the constant current-constant voltage charging process, the mechanical-electrochemical model was used to study the lithium concentration, stress and strain distribution during the charging process.
In the anode particles near the separator, the solid-phase lithium concentration is higher, so their strain is higher, as shown in Fig. 5(c). At the same time, the strain is larger at the free surface of the particles, but smaller at the contact surfaces between particles and between particles and boundaries. This is because the intercalation of lithium ions causes the volume expansion of the particles. The free surface of the particle expands outward, resulting in greater deformation. But under the constraints of adjacent particles and boundaries, the deformation on the contact surface is small. Figure 5(d) shows that the stress distribution is opposite to the strain distribution. This is because the free surfaces of the particles are not constrained and therefore less stressed. But the contact surface is strongly constrained, so the stress is higher. The greatest stress is in the particles close to the diaphragm.
The average strain (meaning the average value of the whole particle in the electrode) and the average stress of the negative electrode particles during constant current charging are shown in FIG. 6 . Both of them gradually increased with time, and their changing trends were basically consistent with the relationship shown in Figure 3. After the CC charging is completed, the mean strain and mean stress reach their maximum values, respectively.
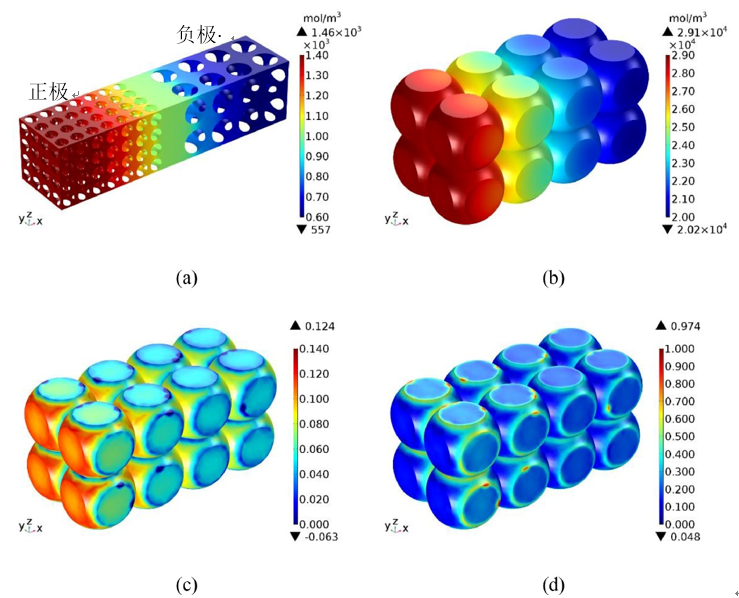
Figure 5. Distribution of lithium ion concentration in electrolyte (a), graphite particle solid phase lithium concentration (b), graphite particle strain (c), and graphite particle stress (d) at the end of 1C CC charging[2]

Figure 6. Average strain and average stress of anode particles during charging of 1C CC [2]
3. Volume expansion analysis in discharge and shelving stages
The resting part B after the discharge of each circle in Fig. 3 is selected for analysis, as shown in Fig. 9 . From the volume curve of shelving, as the discharge rate decreases, the amount of volume change during shelving also decreases gradually, and the time for volume stabilization is gradually shortened. The phenomenon of volume shrinkage in the shelving phase after discharge is similar to that in the shelving phase after charging, both of which are related to the polarization inside the cell and the uneven distribution of lithium concentration. The volume change curves corresponding to different discharge rates are analyzed. As shown in Figure 10, in the initial stage of discharge, the volume of the battery cells has abnormal expansion, and as the discharge rate decreases, the expansion also gradually decreases, which is likely to be related to the The internal thermal effect of the cell caused by the large magnification is also related.

Figure 9. Effect of Discharge Current on Shelf Volume

Figure 10. Effect of Discharge Current on Total Volume and Bounce Volume
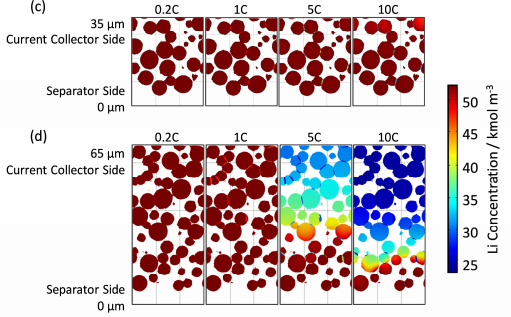
Figure 11. Concentration distribution of particulate solid phase lithium at the end of discharge [3]
3. Summary of the experiment
In this paper, an in-situ gas production volume monitor (GVM2200) was used to monitor the volume expansion behavior of LCO/Graphite system cells at different rates. It is related to the uneven distribution of the lithium concentration in the discharge polarization, and it may also be related to the thermal effect of the cell caused by the current. Therefore, setting an appropriate charge cut-off current can effectively eliminate the influence of uneven distribution of lithium concentration inside the cell on volume expansion. However, since the current during the discharge process is generally large, it is necessary to increase the shelving time after the discharge to stabilize the cell. condition.
References
